Dashboard
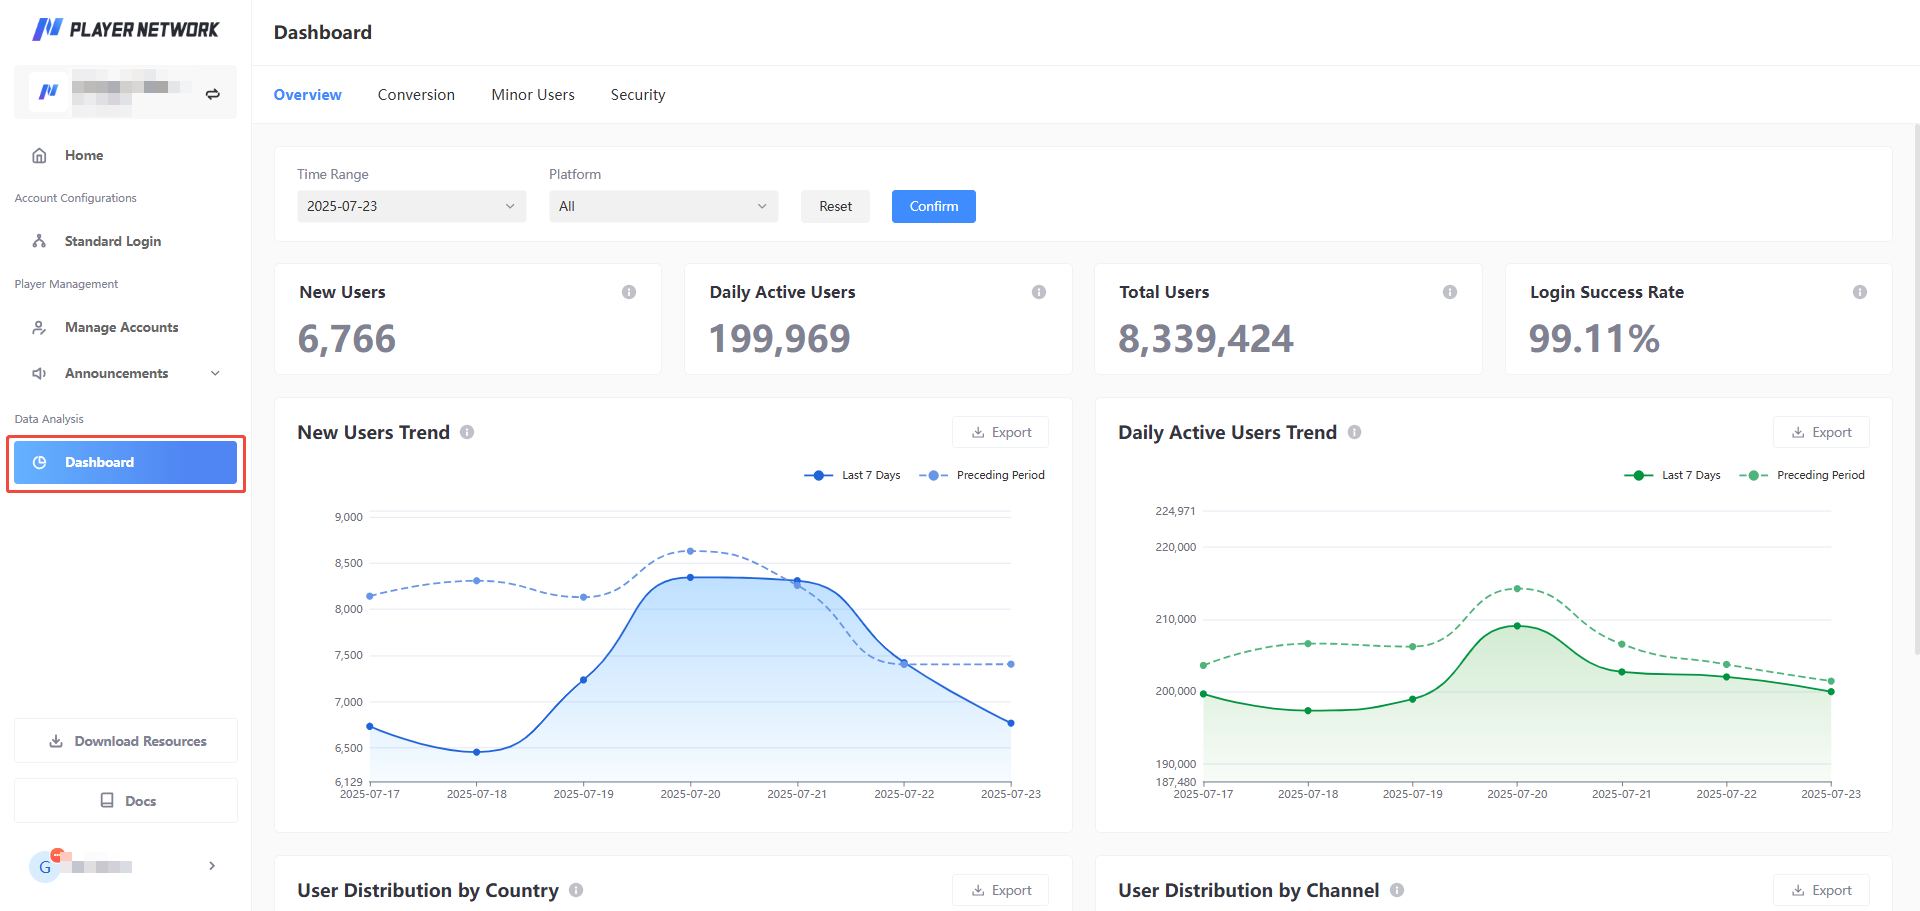
The Dashboard on Player Network Console supports viewing data from four dimensions: Overview, Conversion, Minor Users, and Security. It helps projects monitor and optimize the overall user experience of game account login and account security.
To view and export data from the Dashboard, select Data Report under Data Analysis from Player Network Console.
The Dashboard feature has to be activated, reach out to the Player Network representative for more information.
Only the Owner, Admin, and Data Analyst roles have access to the Dashboard. To gain access to the Dashboard, contact either the Owner or an Admin to be invited to the project or to change your assigned roles.
Overview
Provides insights into the core indicators for account login, with support for filtering by Time Range and Platform, and tabulated by game OpenID.
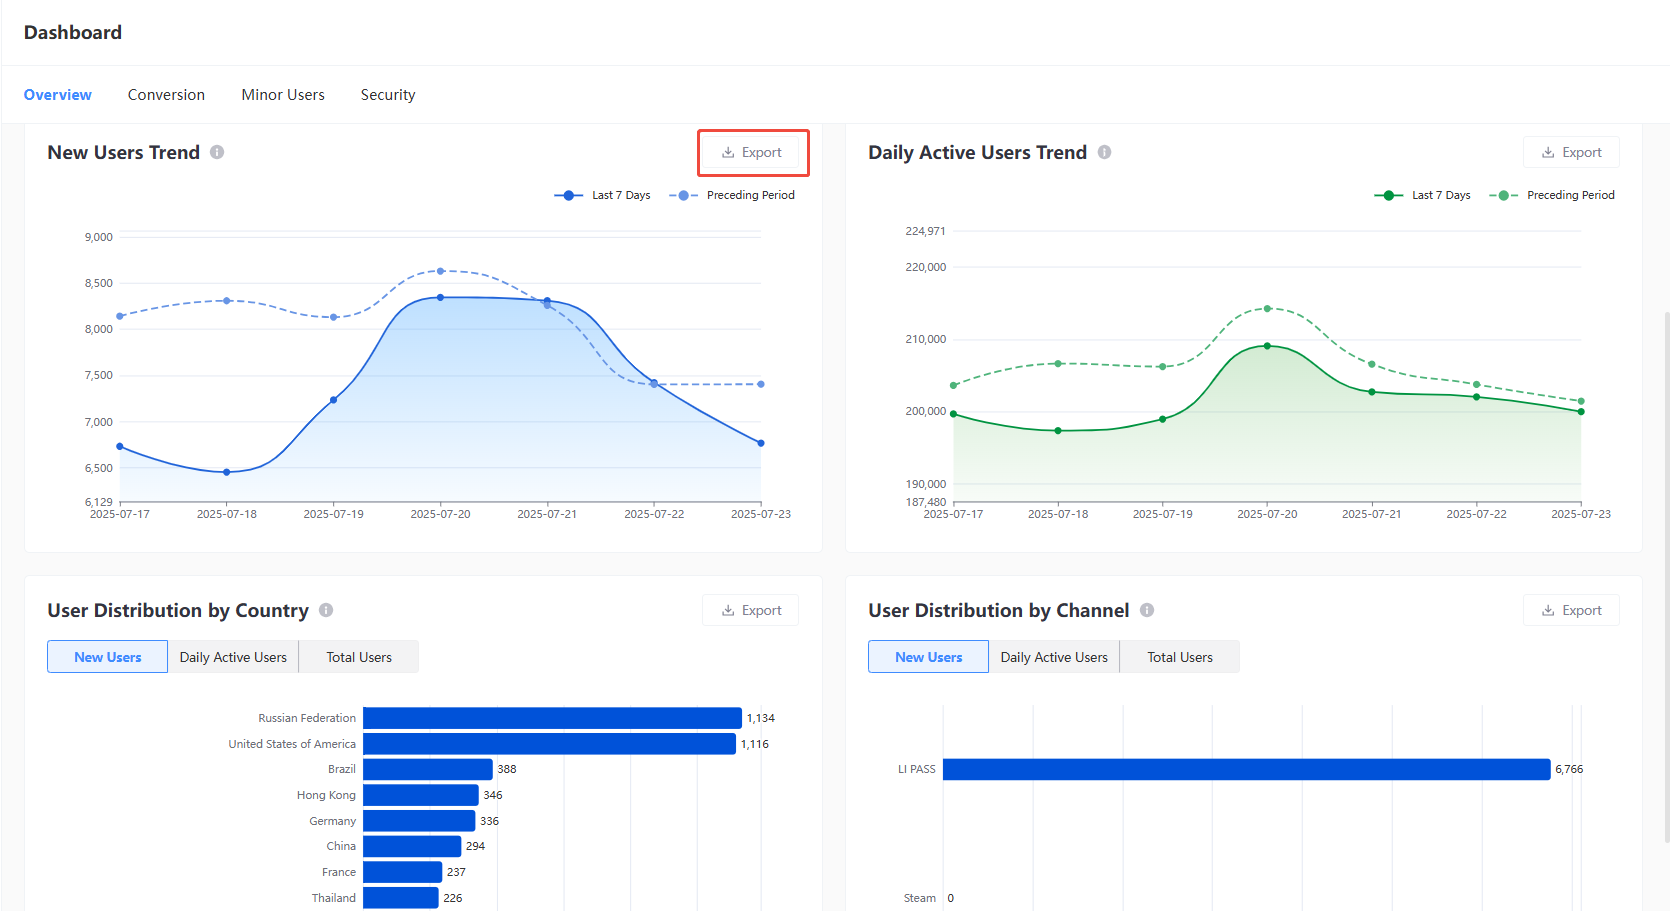
Click Export after filtering to export the data from the corresponding dashboard, in CSV file format by default.
- New Users Trend
- Daily Active Users Trend
- User Distribution by Country
- User Distribution by Channel
Data indicators
| Indicator | Definition |
|---|---|
| New Users | Number of new users within the selected time range. |
| Daily Active Users | Average number of daily active users during the selected time range. |
| Total Users | Total number of registered users as of the last day in the selected time range. |
| Login Success Rate | Percentage of devices with successful logins out of all login requests during the selected time range. |
| New User Trend | Shows the daily trend of newly registered users within the selected time range, with support for comparison against the previous period. |
| Daily Active Users Trend | Shows the daily trend of active users within the selected time range, with support for comparison against the previous period. |
| User Distribution by Country | Displays the distribution of new users, active users, and total users across countries/regions during the selected time range. The chart shows the Top 10, with support for exporting the data for all countries/regions. |
| User Distribution by Channel | Displays the distribution of new users, daily active users, and total users by login method (including LP, third-party channels, and guest login) during the selected time range. The chart shows the Top 10, with support for exporting the data for all channels. |
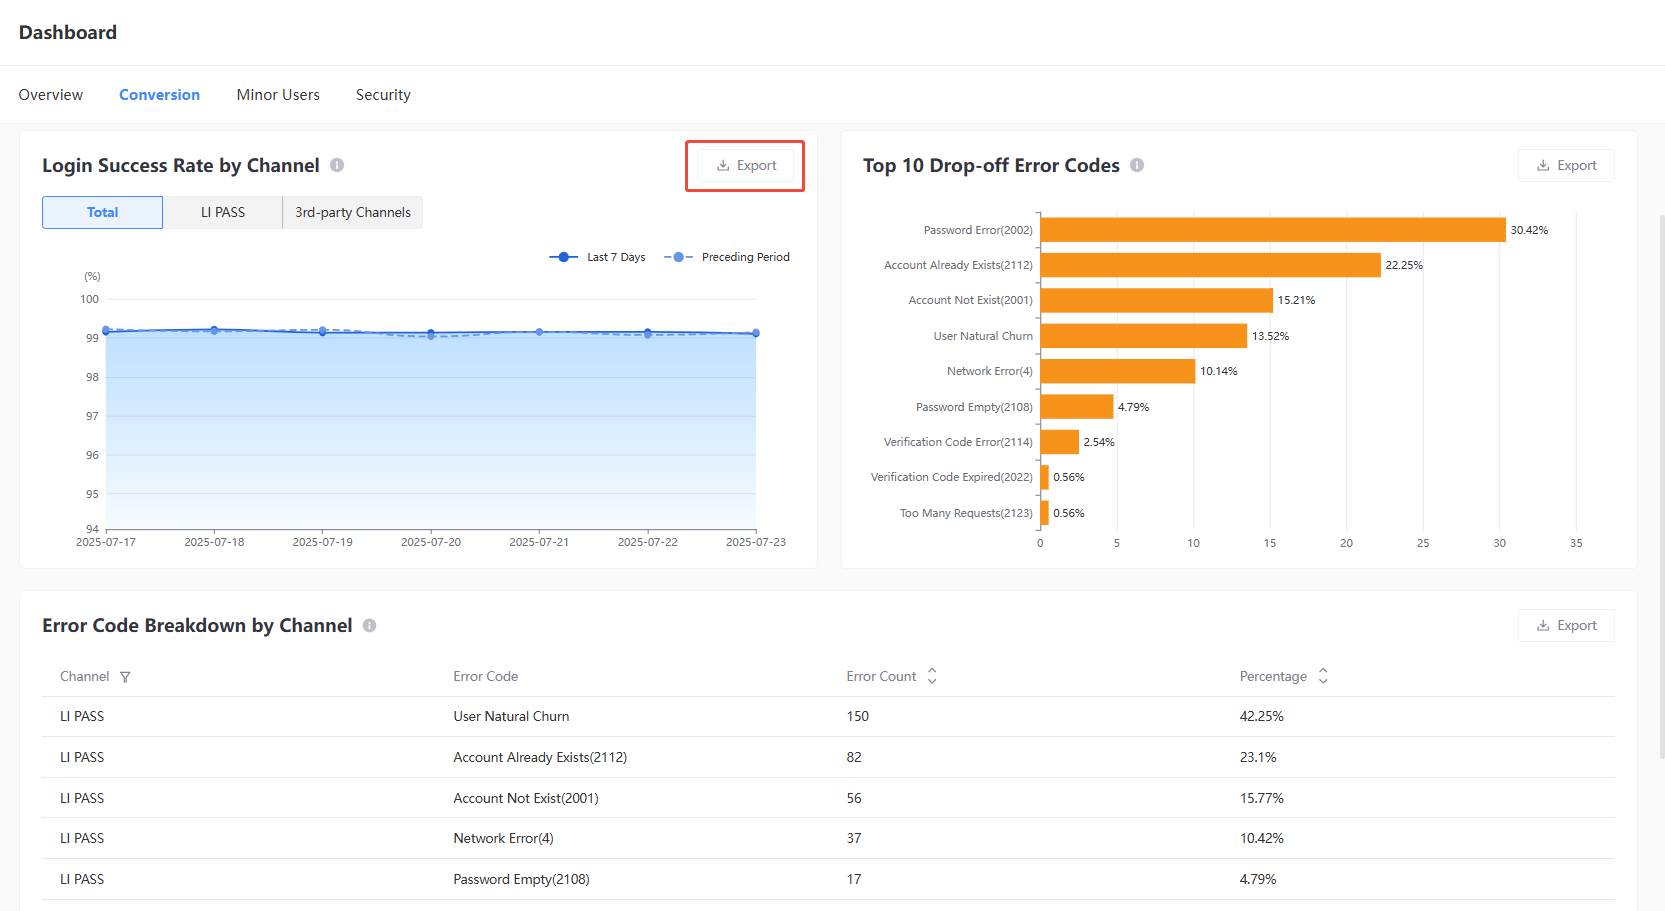
Conversion
Provides insights into the login conversion rates and error codes for various login channels, and supports filtering by Time Range, Platform, Country, and Device Type.
Click Export after filtering to export the data from the corresponding dashboard, in CSV file format by default.
- Login Success Rate by Channel
- Top 10 Drop-off Error Codes
- Error Code Breakdown by Channel
Data indicators
| Indicator | Definition |
|---|---|
| Login Success Rate by Channel | Displays the daily trend of login success rates for each login channel (including LI PASS, third-party channels, and guest login) within the selected time range. Supports comparison with the previous period. Login Success Rate = Number of devices with successful logins / Number of devices with login requests |
| Top 10 Drop-off Error Codes | Shows the distribution of error codes at user drop-off points during registration and login flows within the selected time range. The numbers in parentheses represent the error codes for precise issue identification. The chart displays the Top 10 and supports exporting the full dataset. |
| Error Code Breakdown by Channel | Provides detailed data on all error codes associated with user drop-off points for each login channel during the selected time range, enabling deeper analysis of drop-off causes by channel. |
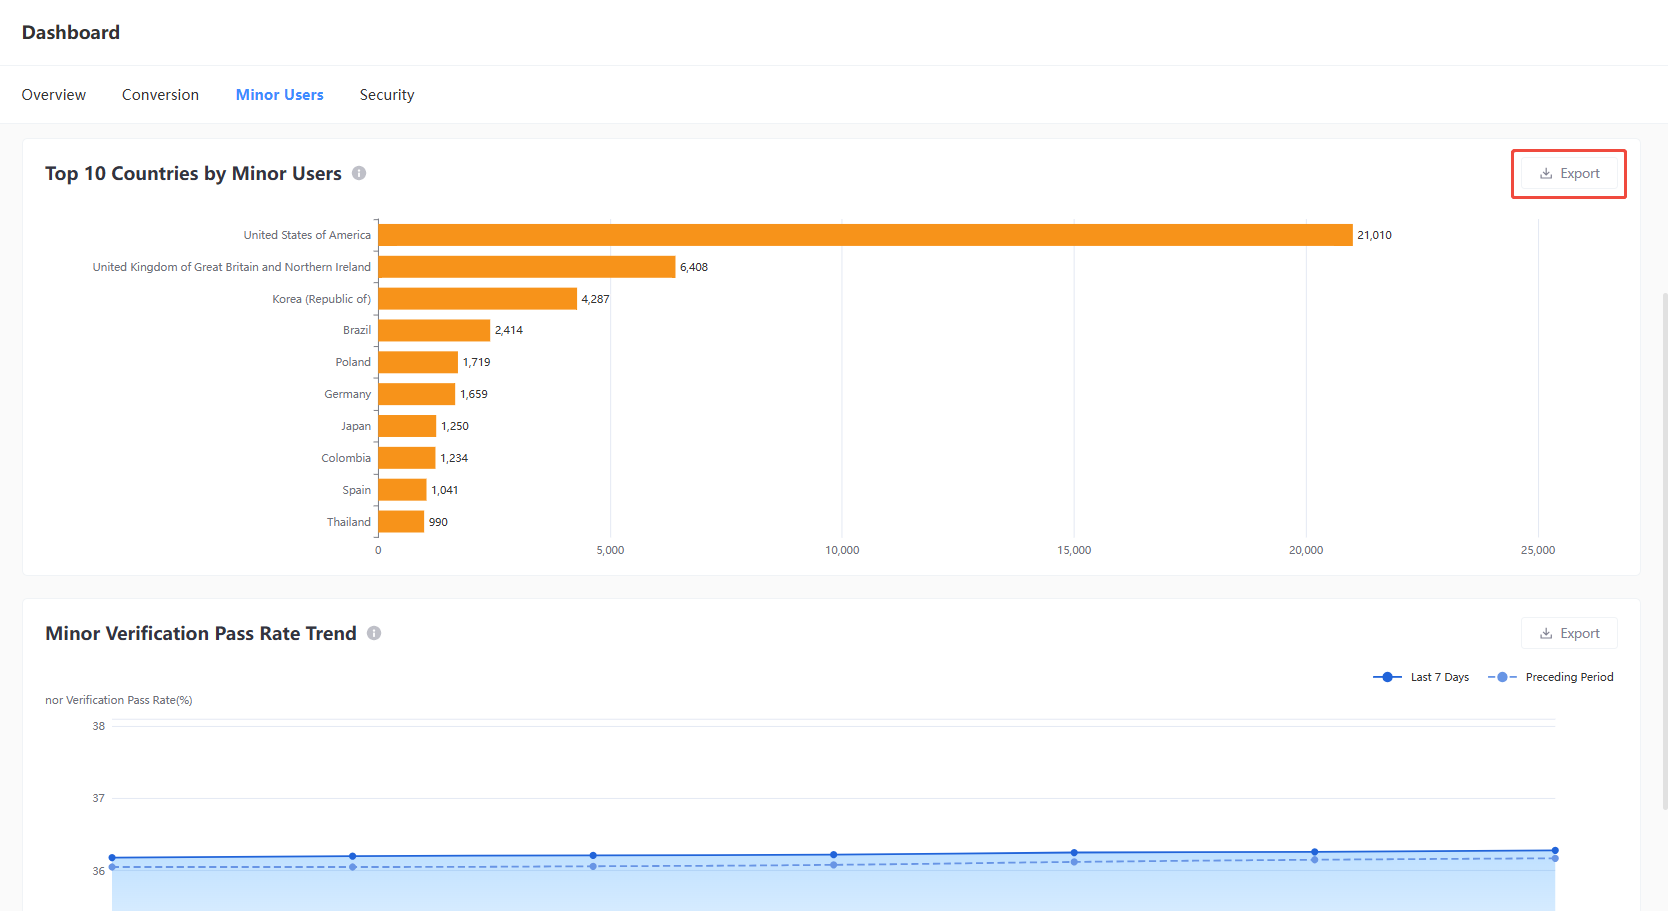
Minor Users
Provides information regarding age verification, with support for filtering by Time Range and Platform. Through these indicators, obtain insights into the data and distribution of minors in the game and the status of age verification.
Click Export after filtering to export the data from the corresponding dashboard, in CSV file format by default.
- Top 10 Countries by Minor Users
- Minor Verification Pass Rate Trend
Data indicators
Wrong format: columns are not matchSecurity
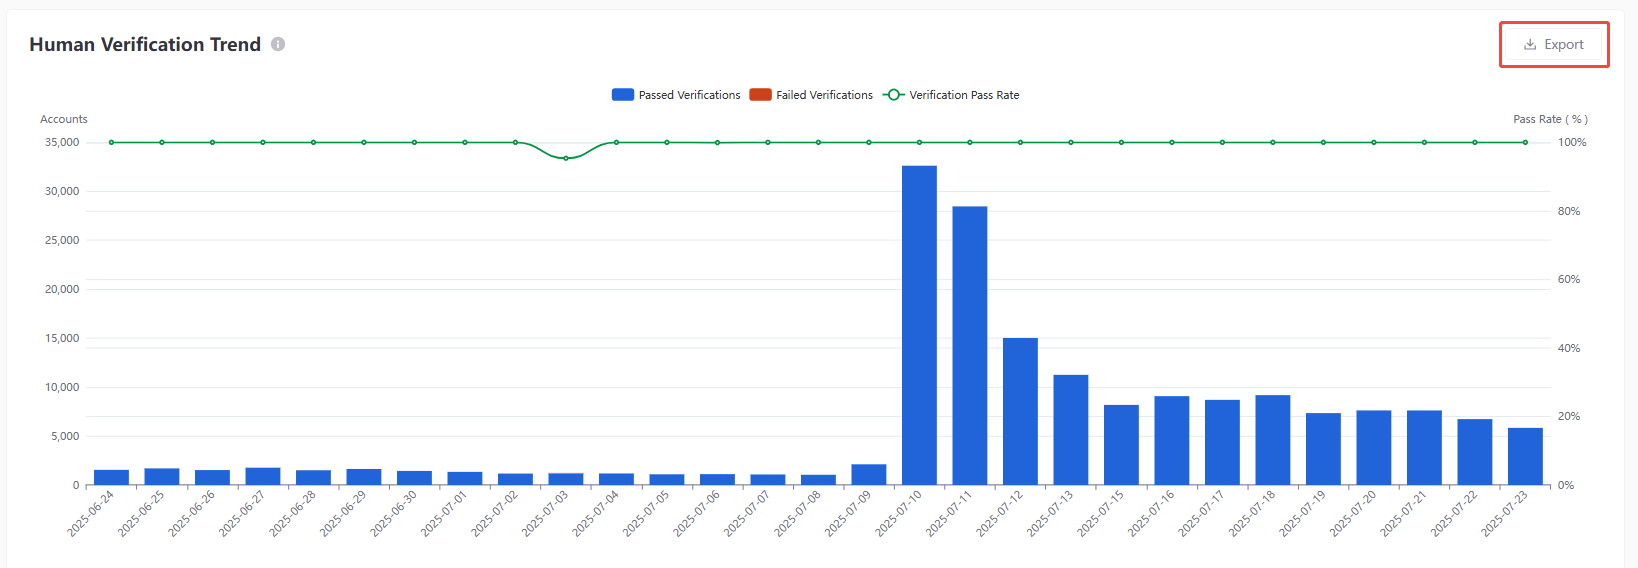
Provides information regarding CAPTCHA verification, with support for filtering by Time Range and Platform. Through these indicators, obtain insights into CAPTCHA scenarios for players.
Click Export after filtering to export the data from the corresponding dashboard, in CSV file format by default.
- Human Verification Trend
Data indicators
| Indicator | Definition |
|---|---|
| Total Verification Attempts | Total number of accounts that triggered the CAPTCHA process as of the last day in the selected time range. |
| Verification Pass Rate | CAPTCHA pass rate as of the last day in the selected time range. Pass Rate = Number of accounts that passed CAPTCHA / Number of accounts that triggered CAPTCHA |
| Blocked Attempts | Number of accounts flagged and blocked as suspicious by CAPTCHA as of the last day in the selected time range. |
| Human Verification Trend | Daily CAPTCHA data within the selected time range, including the number of accounts that triggered, passed, or blocked by CAPTCHA, and the daily pass rate. |